Experimental Determination of the Voltage–Current Characteristics of a 100W PEM Fuel Cell and a Fuel-Cell-Based Framework for Residential DC Energy Management
Keywords:
PEM Fuel Cell, Polarization Curve, Voltage–Current Characteristics, Electrochemical Model, Battery Buffer, DC Microgrid, Energy Management, Hydrogen.Abstract
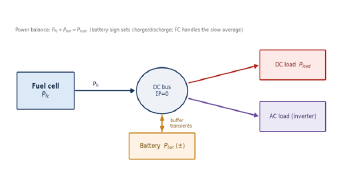
This paper reports the experimental determination of the voltage–current (V–I) characteristics of a 100W proton-exchange-membrane (PEM) fuel cell on a trainer test bench and develops a fuel-cell-based framework for residential DC energy management built on the measured quantities. Using an electronic load, the stack voltage and current were recorded at several load currents after the cell was warmed to its operating temperature, and the stack power was recomputed from the readings. Two data issues are reported transparently rather than hidden. First, the tabulated current is dimensionally consistent with the recorded power only when read in amperes–the original ‘mA’ unit label is a transcription error, confirmed by the procedure’s explicit warm-up at approximately five amperes–so the maximum recorded power is about 75W at 150 A and 0.5 V. Second, the measured V–I curve is non-monotonic: the voltage rises from 0.3 V to a peak of 0.7 V near 15 A before declining, which is opposite to the monotonically decreasing polarization curve expected of a fuel cell and is attributed to incomplete activation or thermal conditioning at the lowest currents and to the small number of sample points. The governing electrochemical relations (Nernst potential and activation, ohmic, and concentration overpotentials are summarized, an ideal polarization curve is shown for contrast and clearly labeled as illustrative, and an energy-management architecture coupling a DC–DC stage, a battery or supercapacitor buffer, and prioritized loads is proposed. Because the fuel cell is a soft, slow source, the framework emphasizes transient buffering and operating point control, and the paper specifies the additional measurements required to obtain a clean polarization curve and a quantitative efficiency.